Evaluate project margin software with a controlled sample project, not a feature checklist alone. Verify calculation transparency, pricing-scenario comparison, baseline handoff, actual-data entry, permissions, rollups, exports, audit evidence, accessibility, and documented limitations. Recalculate outputs independently and test missing data and scope changes. No product can improve margin without a sound cost policy, accurate inputs, and accountable decisions.
Start with the decision and accounting boundary
First decide what the system must help your team do. Common project-level decisions include pricing a fixed-fee proposal, selecting a role mix, comparing plan with actual hours, monitoring cost-budget consumption, reviewing purchase-order margin, or aggregating client and department results. These are different from statutory revenue recognition, workforce-capacity scheduling, or enterprise operating-margin reporting.
Write down the calculation policy before viewing software. At minimum, define:
- the approved revenue basis;
- commission treatment;
- labour cost-rate source;
- non-labour categories;
- shared-cost allocation;
- reporting currency;
- change-order rule;
- which margin layers users may see.
The UK Infrastructure and Projects Authority's guidance backs the same discipline for major-project cost estimates, and the reasoning transfers directly: a documented, evidenced policy is what turns a product demonstration into a reproducible test.
Build a controlled sample project
Create a small test that your team can calculate independently. The figures below are illustrative, not an industry benchmark. Use one fixed-fee project, two roles, a commission, one non-labour cost, a mid-delivery actual-hours update, and a scope-change purchase order.
| Test input | Illustrative value | Evidence to request |
|---|---|---|
| Approved project fee | USD 100,000 | Where the denominator appears and who may edit it. |
| Commission | USD 5,000 | Whether it reduces the delivery budget or enters another cost layer. |
| Senior role | 300 hours at USD 100 cost/hour | Rate source, effective date, and calculation trace. |
| Junior role | 300 hours at USD 50 cost/hour | Role, skill, location, and scenario behavior. |
| Infrastructure | USD 5,000 | Planned and actual treatment. |
| Actual-hours change | Senior +40; Junior -20 | Current recalculation and visible variance. |
| Scope change | USD 20,000 purchase order | Separate record plus correct weighted project rollup. |
Before the demonstration, calculate the expected planned labour cost: USD 30,000 plus USD 15,000, or USD 45,000. Ask the vendor to show every transformation from inputs to gross-margin dollars and percentage. Then enter the same actual-hours change, verify the applicable rates, and recalculate independently. Missing rate, zero fee, and duplicate-scope tests are as important as the happy path.
Use a weighted evidence scorecard
Weighting prevents a polished secondary feature from compensating for an opaque core calculation. Adapt the weights to your risk and workflow; the example below totals 100 and is deliberately not a vendor ranking.
| Criterion | Example weight | Acceptable evidence |
|---|---|---|
| Calculation transparency | 20 | Reconciled input, formula, cost-layer, rounding, and exception results. |
| Pricing and baseline workflow | 15 | Scenario comparison and a controlled selected-plan handoff. |
| Actual-data and variance workflow | 15 | Dated actual entry, planned-versus-actual view, and traceable correction. |
| Permissions and sensitive data | 15 | Role tests for rates, dollars, percentages, edits, and exports. |
| Project and organizational rollups | 10 | Ratio-of-sums result with documented inclusion rules. |
| Audit and export evidence | 10 | Identifiable changes, dates, actors, and usable reconciliation output. |
| Usability and accessibility | 10 | Keyboard, focus, labels, errors, responsive layout, and representative user testing. |
| Implementation and limitations | 5 | Named owners, input process, support model, and written exclusions. |
Weighted score = sum of (criterion weight x evidence rating) / maximum rating
Define the rating scale before scoring. For example, zero can mean no evidence, one can mean a verbal claim, and higher ratings can require a successful test plus documentation. Record critical failures separately; a total score should not hide an unacceptable permission leak or irreconcilable calculation.
Worked example: scoring one vendor on a 0-3 scale
Assume a 0-3 rating scale (0 = no evidence, 1 = verbal claim, 2 = partial evidence, 3 = successful test plus documentation) and apply it to the eight weighted criteria above.
| Criterion | Weight | Rating (0-3) | Weight × rating |
|---|---|---|---|
| Calculation transparency | 20 | 3 | 60 |
| Pricing and baseline workflow | 15 | 2 | 30 |
| Actual-data and variance workflow | 15 | 3 | 45 |
| Permissions and sensitive data | 15 | 2 | 30 |
| Project and organizational rollups | 10 | 3 | 30 |
| Audit and export evidence | 10 | 2 | 20 |
| Usability and accessibility | 10 | 2 | 20 |
| Implementation and limitations | 5 | 3 | 15 |
| Total | 100 | – | 250 |
Weighted score = 250 ÷ 3 = 83.3 out of 100
This vendor scores well on calculation transparency and the actual-data workflow but only partial evidence on permissions and usability. An 83.3 total is not a purchase decision by itself: if the permissions walkthrough in the next section reveals a client-facing role can see internal pay rates, that critical failure should block the decision regardless of the score above it.
Test controls, audit evidence, and accessibility
Financial inputs deserve least-privilege access and a clear record of material changes. NIST describes access control as a core protection for systems containing financial and privacy information, while its security guidance covers defining audit events, audit-record content, review, and protection. These sources do not certify a vendor; they provide defensible questions for the evaluation.
- Can a presales user compare percentages without seeing sensitive cost rates?
- Can only authorized roles edit rate cards, actuals, and allocation rules?
- Can reviewers identify what changed, when, and by whom?
- Can exports be reconciled to screen totals and filtered populations?
- What happens when an authorized rate changes during a project's life?
Accessibility also belongs in the test plan. WCAG 2.2 is a W3C Recommendation with testable success criteria. Evaluate keyboard operation, visible focus, form labels, error identification, contrast, zoom, and responsive reading order in the actual workflows your users need. Do not treat a vendor statement as proof of conformance.
How this plays out on a real staff-augmentation pilot
Consider a 30-person IT staff-augmentation firm that places consultants with three mid-size enterprise clients and is piloting two shortlisted vendors on live data before renewing its margin-tracking tool. Running the process above against a real book of business, rather than a vendor demo, surfaces problems a checklist alone would miss.
- At kickoff, the evaluation team discovers it never agreed whether "cost rate" means a consultant's pay rate or pay rate plus benefits load, and the two vendors default to different assumptions, producing margin figures several points apart on the same roster. Handling: fix the labour cost-rate source in the written policy above before either vendor sees the data — see cost rate versus billing rate for the distinction that trips up most first-time evaluations.
- Mid-pilot, a consultant rotates from one client account to another partway through a month. One vendor splits that week's hours correctly across the two client budgets; the other needs a manual correction and leaves a reconciliation gap. Handling: this is exactly the kind of missing-data and scope-change condition the controlled sample project should force, not an edge case to skip.
- At the first monthly rollup across all three client accounts, one vendor's portfolio view averages the three engagement margins instead of weighting by revenue, understating the true blended result. Handling: the scorecard's rollup criterion and the rule against averaging margin percentages exist precisely to catch this before a contract is signed.
- At the vendor-selection meeting, a strong calculation-transparency score for one product is undercut when a walkthrough shows a client-facing account manager can see internal pay rates in an export. Handling: record this as a critical failure kept separate from the total score, as the scorecard guidance above recommends, rather than something a high overall score can offset.
None of this is exotic. It is the ordinary friction of running two systems against one live book of business, which is why a scored pilot on real data finds these problems before a renewal decision has to live with them.
Where Managed Margin currently fits
Managed Margin connects project pricing with delivery-margin tracking for consulting and professional-services teams. The current product supports:
- role-based rate cards;
- resource-loading scenarios;
- fixed-price scenario comparison;
- promotion of a selected scenario into a delivery project and purchase order;
- manual weekly actual-hours updates;
- planned and current gross-margin calculations;
- a product-specific after-shared-cost Managed Margin layer;
- budget-consumption alerts;
- permission-controlled financial detail;
- project, client, department, and portfolio views.
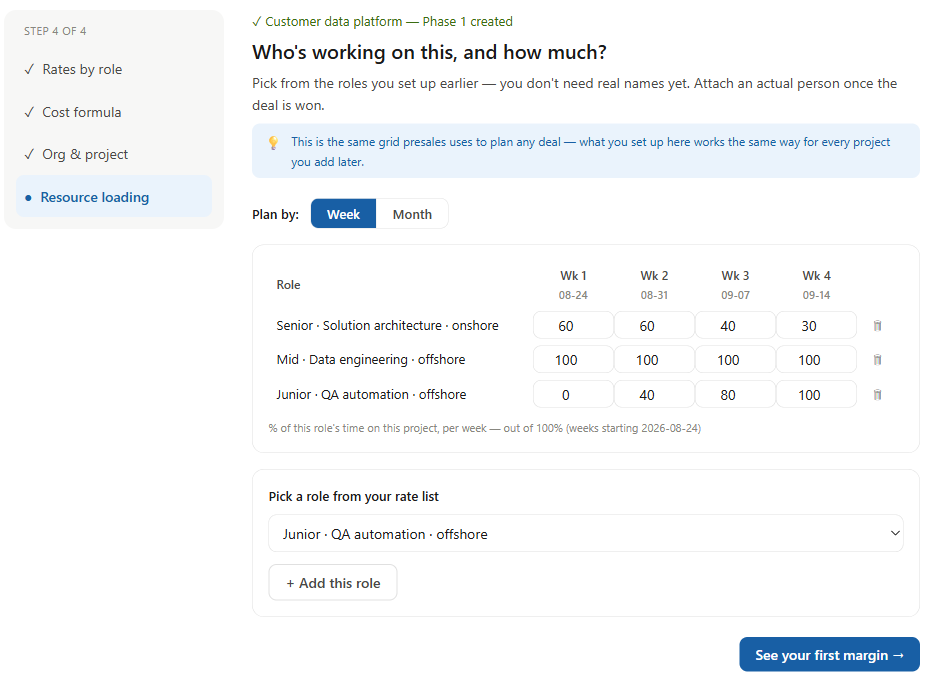
Managed Margin does not automatically import timesheets, payroll, HR, accounting, or CRM data. It does not provide predictive final-margin forecasts, workforce-capacity planning, operating margin, or net margin. Actual hours are entered manually. Current aggregate rollups use planned gross margin, and product outputs depend on the accuracy and policy consistency of supplied inputs.
Final evaluation checklist
- Write one primary workflow and explicit calculation boundary.
- Use identical controlled data for every shortlisted product.
- Recalculate the expected result outside the system.
- Test scenario comparison and selected-baseline handoff.
- Enter actuals, corrections, missing rates, and a scope change.
- Verify weighted rollups; never accept a simple average of margin percentages.
- Test each representative role, including exports and direct URLs.
- Inspect audit evidence and data-retention behavior.
- Run keyboard, zoom, error, and responsive-layout checks.
- Document integrations, forecasts, margin layers, and other exclusions in the decision record.
- Name the internal owners for rate policy, actual entry, review cadence, and exceptions.
Use the professional-services project margin guide to define the workflow, the calculation guide to build your expected result, the weighted rollup guide to test aggregation, and Managed Margin pricing when assessing total fit.
Sources and methodology
- UK Infrastructure and Projects Authority, Cost Estimating Guidance, published 17 March 2021. Used for methodology, assumptions, exclusions, evidence, ownership, and consistent baseline principles.
- U.S. National Institute of Standards and Technology, Assessment of Access Control Systems. Used to frame authorization and sensitive-data evaluation questions.
- U.S. National Institute of Standards and Technology, NIST SP 800-171 Revision 3. Used for audit-event, audit-record content, review, and protection questions; not as a product-compliance claim.
- World Wide Web Consortium, Web Content Accessibility Guidelines (WCAG) 2.2, W3C Recommendation updated 12 December 2024. Used for accessibility-test categories.
- Managed Margin capabilities and limitations were checked against the current application implementation on 24 August 2026. Test figures, weights, and ratings are illustrative and should be adapted to the buyer's policy and risk.