Project margin management software

Know your margin before you quote it

Price the job from what your team actually costs, then track whether that margin survives delivery.

Currently freeNo credit card · No time limit · View plan details

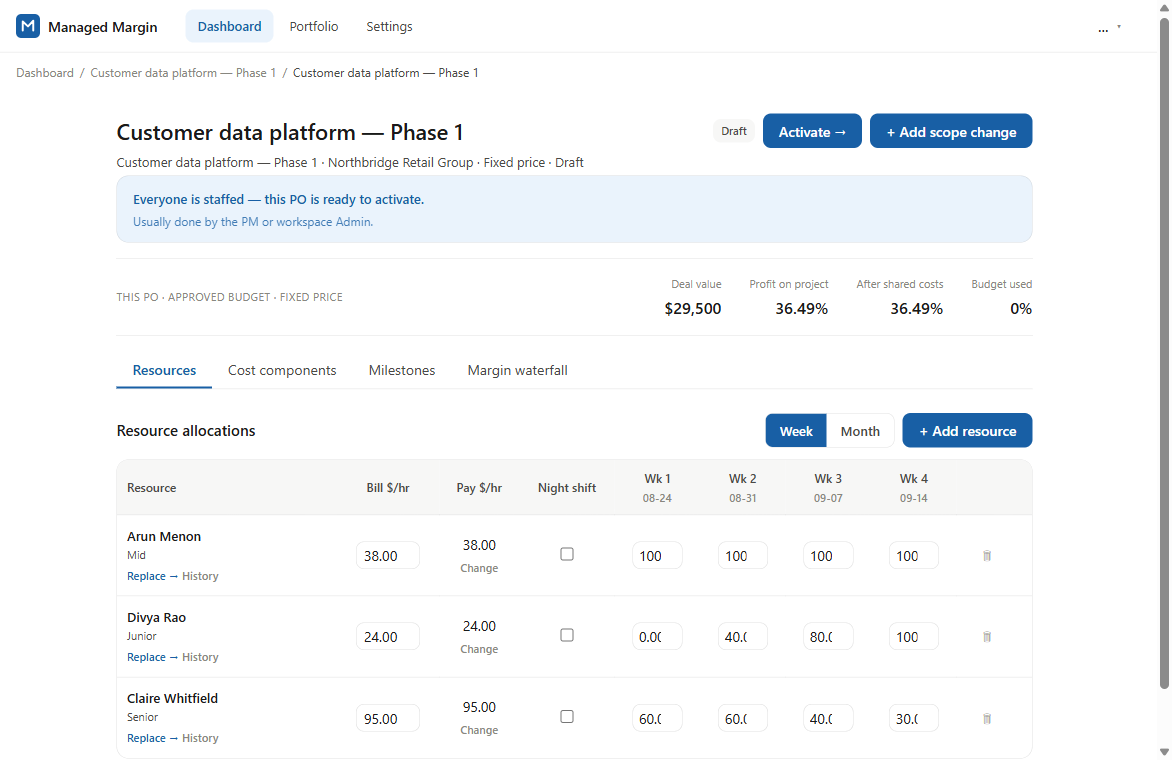
A fixed-price purchase order in Managed Margin showing a $29,500 deal value and 36.49% profit, above the staffed team and their weekly hours

A $29,500 fixed price, the team behind it, and the 36.49% left after their cost.

From quote to delivery

One project. Three chapters.

Follow the work from the first price to the hours actually spent.

Chapter 01 Price the work

Build the team.
See the margin.

Build the team, enter the price, and see what is left after cost, commission and overhead — before you send anything.

Explore project pricing
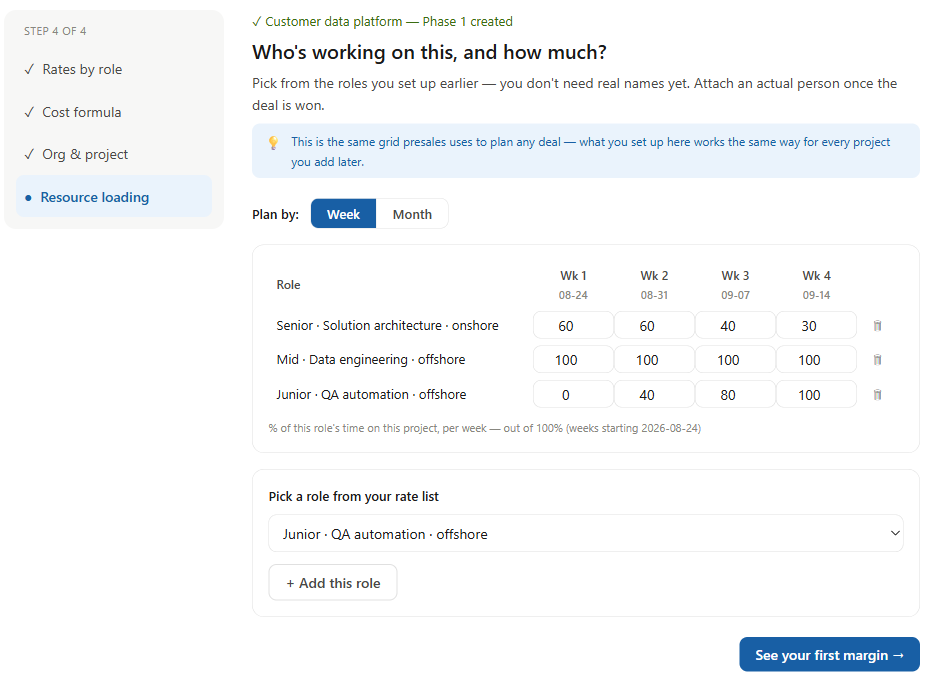
Managed Margin resource plan with three roles and their allocations across four weeks
The roles and hours behind the price you quote.
Chapter 02 Win the work

One agreed plan.
A clear handoff.

The option you choose becomes the project’s agreed plan — the team, the rates, and the margin it was built on.

See how the handoff works
Managed Margin project ready to activate, with a $29,500 fixed price, 36.49% margin, and assigned resources
The agreed price and staffed team, ready for delivery.
Chapter 03 Track the work

Hours go in.
The picture updates.

Enter actual hours each week. See planned against actual margin, and which people are running over their hours.

Explore margin tracking
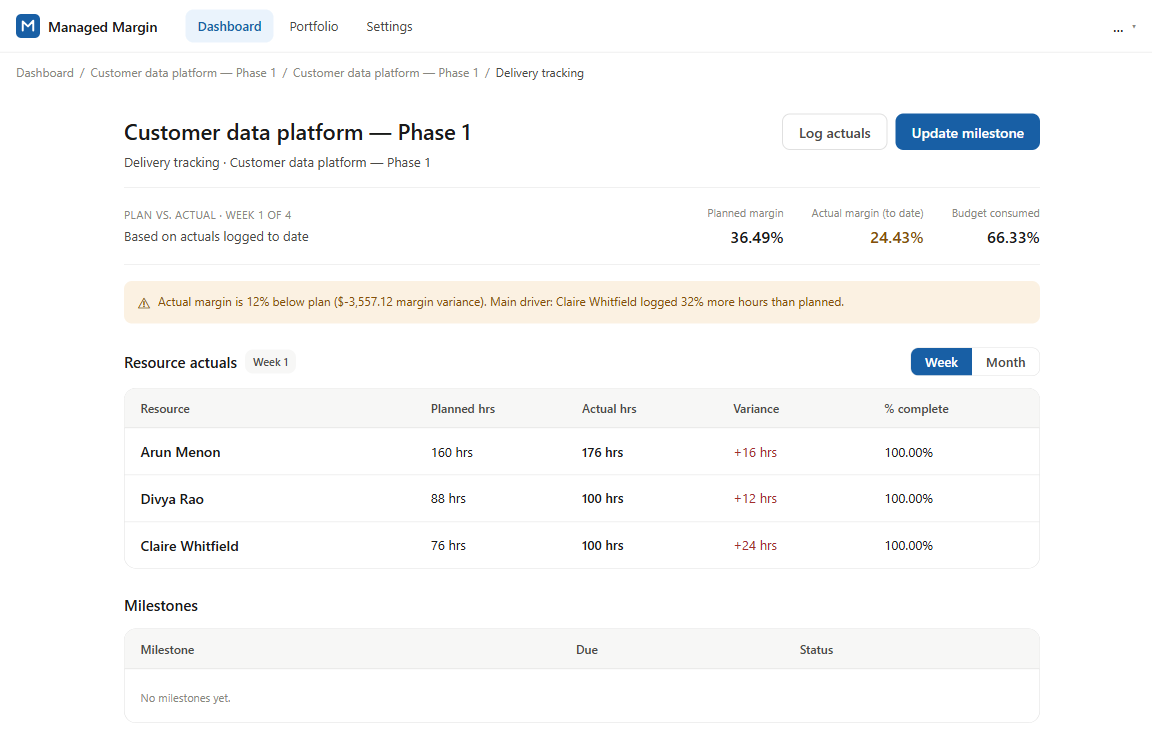
Delivery tracking showing 36.49% planned margin, 24.43% actual margin, and hours over plan by person
The same project, now showing what delivery actually used.

The difference in daily work

What Managed Margin actually does

A closer look at the decisions behind a healthier project margin.

Perspective 01 Clarity before the quote

Price confidently.

Build the team, enter the price, and see the margin left after cost, commission and overhead — before you send anything.

Explore project pricing
One example project
Fixed price$29,500
Team, rates & planned hours
Planned margin36.49%
Figures from the project shown above.
Perspective 02 The right view for each role

Share the margin.
Protect your rates.

Sales and Presales see the margin percentage and whether a project is healthy — never a colleague’s pay rate or a dollar figure.

See who sees what
Sales & Presales
Margin & project statusVisible
Pay rates & dollar figuresPrivate
A simple view of role permissions. Full details are one click away.
Perspective 03 Clarity while the work runs

Catch margin
erosion.

Compare planned hours with actual hours while the project runs, and see which role is pulling the number down.

Explore margin tracking
The same project, during delivery
Planned margin36.49%
Actual to date24.43%
+52team hours
over plan
Actual margin to date, based on the hours entered.

Product screenshot
Real numbers, one live project

See exactly where the margin went

Planned margin, actual margin to date, and the hours behind the gap — on the same screen delivery already uses.

Managed Margin delivery tracking showing planned margin 36.49% against actual 24.43%, with hours over plan for each person
Planned36.49% Actual to date24.43% Team hours+52 over plan

The same job at 24.43% once the real hours went in — 52 hours over plan across three people, one of them alone accounting for 24.

Why a spreadsheet stops working

Keep the numbers with the project

A spreadsheet prices a job fine. The problem is afterwards: the file stays with whoever built it, and delivery never sees the hours the price assumed.

Priced in a spreadsheet

Separate
Several versions of the price, and no one is sure which was sent
Delivery gets the scope but never the hours it was priced on
Comparing planned with actual means rebuilding the sums by hand
Questions

Common questions

Start with your rates and one project

Free to use at the moment. The pricing page lists the limits.