Baseline
What was sold, frozen when the strategy was finalized.
Project margin tracking software
Project margin tracking software for services teams: compare the margin you sold with what delivery is earning, while there is still time to act.

One project, three perspectives
Each shows the Managed Margin, after every cost, and answers a different question. Planned vs actual project margin
What was sold, frozen when the strategy was finalized.
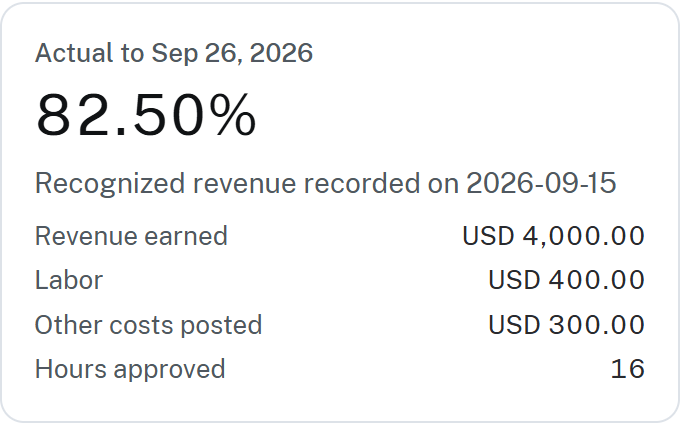
Approved time, posted costs and recognized revenue so far.
Cost to date plus the remaining plan and expected costs.
What feeds actual margin
Weekly time counts once the project manager approves it. Expenses and recognized revenue are posted in the project.
A guided workflow
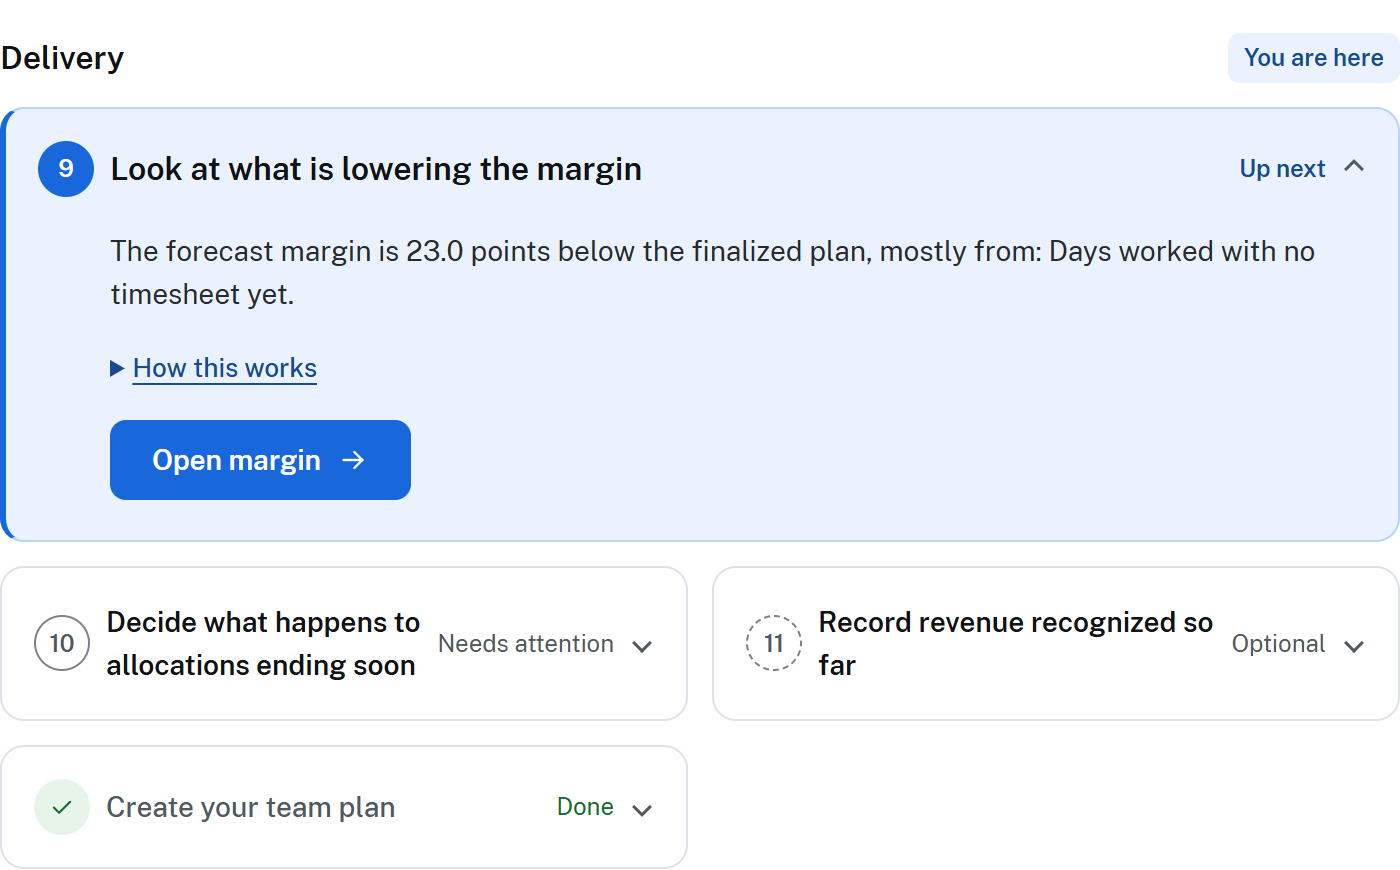
Each service order puts the most urgent step first, so the project manager always knows what to do next.
Project margin variance
Variance is shown in points against the baseline, with the drivers in money and project budget vs actual cost by category. On fixed-price work, every hour over plan comes straight off the margin.
Project margin variance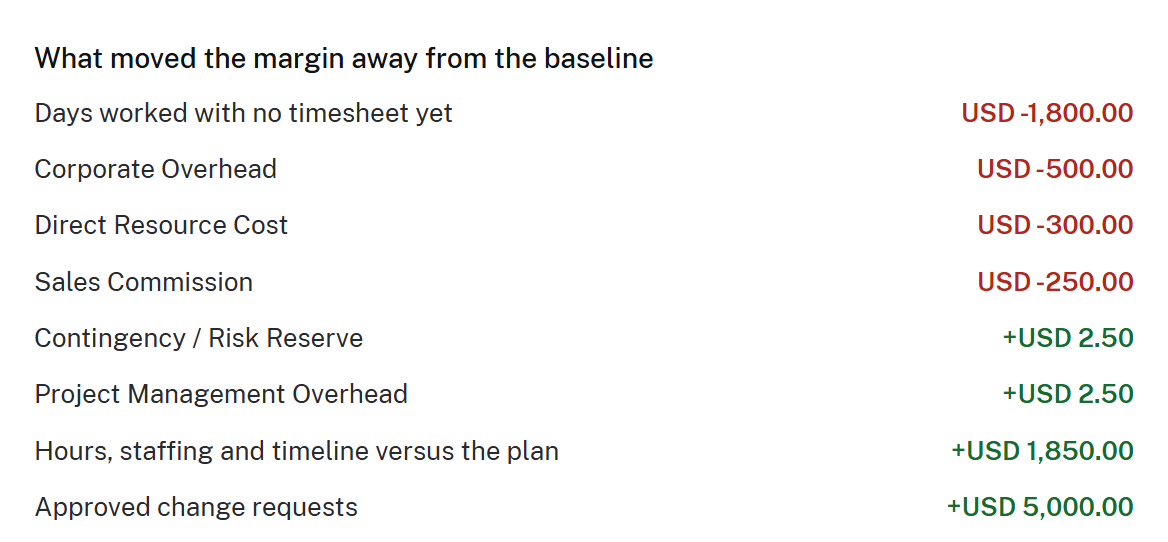
Forecast at completion
Enter how many weeks longer the work might run to see the margin, cost at completion and end date. Nothing is changed or saved.
Protecting fixed-price project margin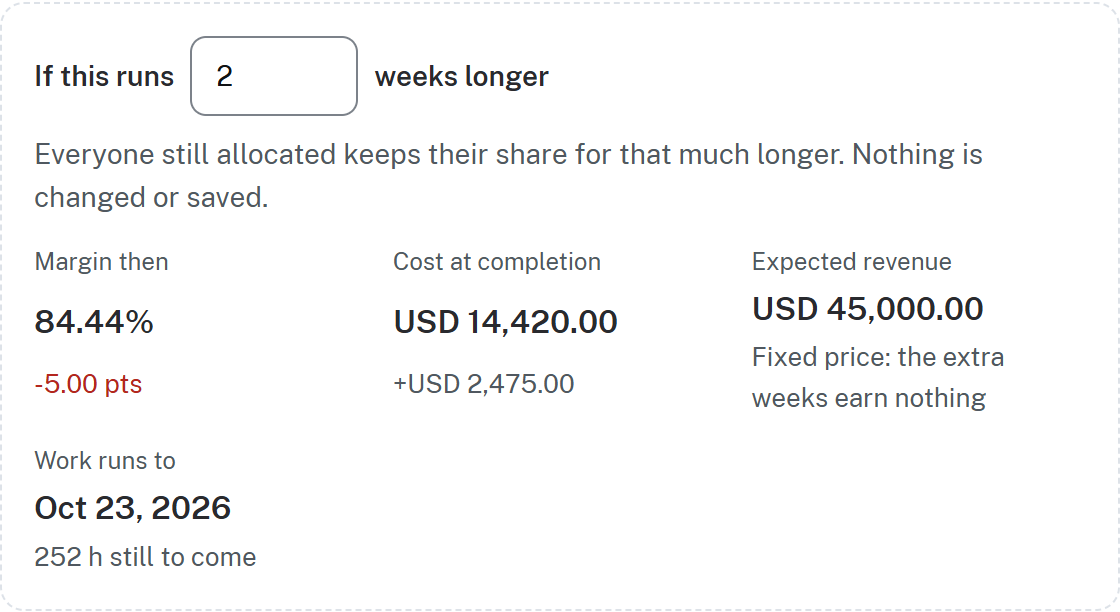
Client and portfolio reporting
The Client Portfolio report shows each client’s pipeline, won business, revenue earned, Managed Margin as sold and where it is heading, and win rate. Delivery Margin totals every service order in delivery.
How to roll up project margin
Short answers, with a guide for each.
The project manager records weekly timesheets, which count once approved; expenses are posted in the project. Project margin review checklist.
Yes. Missing timesheets never block completion: once delivery is complete, allocated days with no recorded time count as worked, at each person’s cost, and are labelled as counted from allocations. Planned vs actual project margin.
No. It is cost to date plus the remaining plan and expected costs, and you can see every figure behind it. How to read margin variance.
Delivery still works: the seat's finalized planning rate is used, and cost-basis coverage shows how much is actual. Cost rate vs billing rate.
Yes. Delivery Margin totals every service order in delivery, by business unit, and the Client Portfolio report shows each client’s won business, Managed Margin and win rate. How to roll up project margin.
Weekly for short or fixed-price work, monthly for long, stable engagements. Choose a review cadence.
Yes, as a calculation rather than a prediction. The forecast is the recorded actuals plus the remaining plan you enter, so you can see the project’s margin at completion if the rest of the work goes as planned, and compare it with the approved baseline. It is project margin tracking and analysis for consulting and services teams, built from the hours, costs and revenue recorded in the project. Planned vs actual project margin.
Bring your team plan, recorded time and delivery costs into one review.