Project margin management is the process of defining a project's price, delivery-cost assumptions, and planned margin before sign-off, then comparing that baseline with actual effort and supported costs during delivery. For professional-services firms, it connects presales, finance, and project management around one question: is the work being delivered on the economic assumptions that were approved?
What does project margin management measure?
At its simplest, project margin is the difference between the revenue basis assigned to a project and the delivery costs included by the firm. The percentage expresses that difference relative to the same revenue basis.
Project margin = project revenue basis − included project delivery costs
Project margin % = project margin ÷ project revenue basis × 100
The formula is simple; the policy behind it is not. A useful margin review must state whether delivery cost includes pay-rate labour, employment on-costs, subcontractors, infrastructure, sales commission, project overhead, or a share of central costs. Two firms can use the same formula and produce different percentages because they include different costs.
For example, a project with a documented USD 100,000 revenue basis and USD 65,000 of included delivery costs has a margin of USD 35,000, or 35%. The calculation guide works through a fuller version of this same arithmetic with commission, labour overhead, and infrastructure broken out line by line.
This guide describes an internal project-control view, not statutory revenue recognition, tax, or financial-statement policy. Finance should define the approved revenue and cost basis used by the firm.
Why should margin management begin before sign-off?
A delivery team cannot compare actual performance with a useful baseline if the proposal only preserves a final price. The baseline also needs the assumptions behind that price: the roles, level of effort, duration, cost rates, non-labour costs, and scope boundary.
This is especially important for fixed-price work. The approved client fee does not automatically rise when delivery takes more hours. A Project Management Institute case study describes fixed-price work as having a bidding cycle and a delivery cycle, and emphasizes clear scope, a defined baseline, progress assessment, and captured costs. The lesson is not that every services firm needs formal earned-value management; it is that the delivery review needs a traceable plan.
Four questions before a proposal is approved
- Which roles and skills are needed to deliver the scope?
- How much of each role is needed, and for how long?
- Which governed cost assumptions apply to those roles?
- Does the proposed fee leave an acceptable margin after the costs included by the firm?
These four questions assume the proposed fee holds through signature. If it is negotiated down before the contract is signed, the margin math changes before delivery even starts — see how discounts affect project margin for what a late-stage discount actually costs against a fixed delivery-cost plan.
The worked resource-loading pricing example shows how these inputs can be calculated without pretending the result is a forecast.
What is the proposal-to-delivery margin workflow?
A practical workflow has five connected stages. Each stage should preserve the assumptions needed by the next team rather than asking that team to rebuild them.
| Stage | Decision | Evidence to retain |
|---|---|---|
| 1. Cost policy | Which rates and cost components are controlled? | Role, skill, location, pay-cost basis, billing rate where relevant, commission, overhead, and effective dates. |
| 2. Pricing scenario | Which team can deliver the scope at the proposed fee? | Roles, allocations, duration, deal budget, calculation assumptions, and scenario result. |
| 3. Approval and handoff | Which option becomes the delivery baseline? | Approved budget, chosen resource assumptions, scope boundary, and reviewer decision. |
| 4. Delivery actuals | What effort and supported cost have been recorded? | Actual hours by resource and period, progress context, cost changes, and reasons for material variance. |
| 5. Review and action | What changed, why, and who owns the response? | Hours variance, cost variance, budget consumption, margin difference, scope decision, and follow-up owner. |
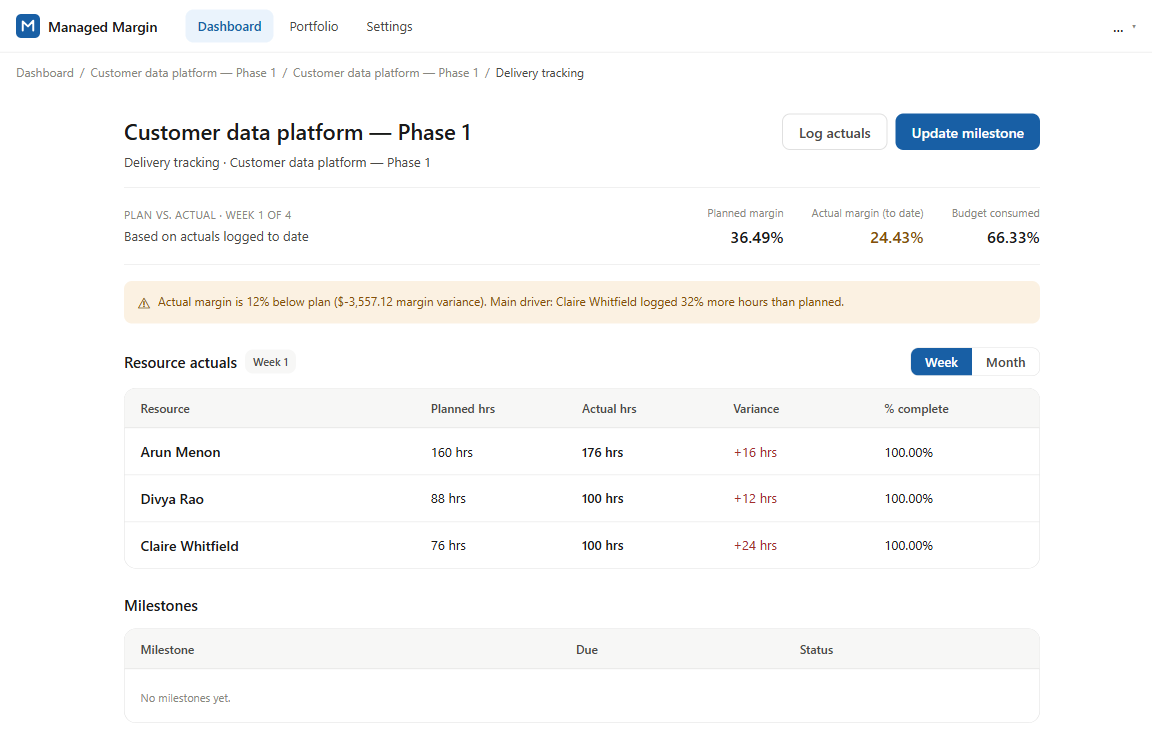
What should a project-margin review compare?
A weekly or milestone review should use the same units and period on both sides of every comparison. It should also separate a current observation from a prediction. A fully-booked team is not the same signal as a healthy margin—see why utilization and project profitability can move in opposite directions.
| Review question | Useful comparison | Common mistake |
|---|---|---|
| Is effort following the plan? | Planned and actual hours by resource and period. | Looking only at total hours, which can hide an expensive role mix. |
| Is cost following progress? | Supported cost recorded, budget consumption, and delivery progress. | Treating budget consumed as the same thing as work completed. |
| Did the margin basis change? | Approved price and included planned costs versus the current calculation on the same basis. | Comparing percentages built from different revenue or cost definitions. |
| Where did variance originate? | Resource-hours variance, rate or team-mix change, scope change, and non-labour cost. | Calling every difference "scope creep" without tracing the driver. |
| What should happen next? | Named decision, owner, and review date. | Assuming a dashboard automatically fixes the delivery problem. |
The planned-versus-actual project margin review turns this into a repeatable meeting checklist and worked example.
How this plays out on a staff-augmentation engagement
Consider a professional-services firm that agrees to staff-augment a client's IT team with a project lead and four developers, billed time-and-materials over six months, with a small fixed-price reporting module carved out partway through. The same workflow applies differently at each point.
- Before sign-off. Staff-augmentation rates vary widely by seniority, so the four questions above need answering role by role—not as one blended day rate—or the approved margin assumption will not match what actually gets staffed.
- Pricing the engagement. Because the work is billed time-and-materials, it is tempting to treat the billing-rate total as the margin. It is not: planned margin still needs the cost side of each role, including on-costs, which is why cost rate and billing rate stay separate fields even on T&M work.
- Mid-engagement, when the client asks to swap in a more senior developer. Record the new rate and the reason as delivery-actuals evidence—stage 4 of the workflow above—rather than letting it disappear into an unexplained hours or cost change.
- When the reporting module is carved out as fixed-price. That module needs its own approval and handoff—stage 3 above—with its own budget and role plan. Reusing the T&M team's hourly assumptions without re-approving them as a fixed-price baseline blends two different commercial models into one number.
- At the periodic review. A fully booked team is not proof the engagement is on margin; use the same review questions above to separate hours following plan, cost following progress, and whether the basis itself changed.
Can a spreadsheet manage project margin?
Yes—when the workbook has controlled inputs, visible formulas, named ownership, version discipline, and an agreed review process. Governance gets harder as teams, rate sensitivity, and scenario count grow; see the governance failure conditions and when to replace it with dedicated software for the full breakdown, and the project-margin spreadsheet template structure for which inputs, formulas, and controls a workbook needs.
Dedicated software can reduce version handling and preserve a structured baseline, but it does not remove the need for cost policy, scope decisions, or accurate actuals. The tool is only as current as the data supplied to it. If you are comparing options, these are the calculation, baseline, access, and data-boundary questions to ask a vendor.
What Managed Margin currently does
Managed Margin currently supports:
- Fixed-price resource-loading scenarios.
- Controlled rate data.
- Promotion of one scenario into project setup.
- Weekly actual-hours entry by authorised users.
- Calculated planned and current margin views.
- Margin calculated on a stated basis.
- Supported budget-consumption alerts.
- Margin rollups by project, client, department, and portfolio.
See the complete Managed Margin workflow or what the product's own margin metric measures.
What Managed Margin does not currently do
It does not import employee timesheets, payroll, HR, CRM, ERP, invoicing, or accounting data. It does not predict final project margin or calculate operating or net margin. Promoting a pricing scenario creates the fixed-price budget and placeholder allocations; it does not automatically activate the project.
Where should a professional-services firm start?
- Agree on one project-margin definition and document which costs it includes.
- Select one fixed-price project with a clear approved fee and resource plan.
- Record the original roles, hours, rates, duration, and non-labour assumptions.
- Assign one owner for periodic actual-hours and cost updates.
- Review resource variance, budget consumption, margin difference, and scope decisions together.
- Keep the baseline intact; record approved changes rather than silently overwriting the original plan.
For the product workflow, explore project pricing and scenario planning and planned-versus-actual margin tracking.
Sources and methodology
- Project Management Institute, Managing fixed-price projects using earned value management. Used for the bidding/delivery cycle, baseline, progress, and actual-cost principles. Managed Margin does not claim to implement formal EVM forecasting.
- UK Infrastructure and Projects Authority, Cost Estimating Guidance. Used as an authoritative reference for transparent estimates and stated assumptions.
- Product statements were reviewed against the current Managed Margin implementation on 23 August 2026. Examples in this article are educational and do not represent a customer result.