Utilization and project profitability answer different questions. Workforce utilization compares selected working hours with available hours; project profitability compares an approved revenue basis with included delivery costs. A team can be highly utilized on a low-margin project, or less utilized on a high-margin one. Managed Margin tracks project hours, budget consumption, and margin; it does not provide workforce-capacity planning.
Define each metric before comparing it
There is no useful comparison until the numerator, denominator, period, and population are explicit. For this article, workforce utilization means selected working hours divided by available working hours for the same people and period. Each firm must decide whether the numerator includes only billable delivery, all client work, internal work, leave, or another category.
Workforce utilization % = selected working hours / available working hours x 100
Project margin % = (approved revenue basis - included project costs) / approved revenue basis x 100
Utilization is a time-allocation ratio. Project margin is a financial ratio. They may share hours as an input because labour cost often depends on time, but utilization does not contain the project's fee, role cost rates, non-labour costs, or allocated shared cost. It therefore cannot substitute for a margin calculation. Sales-side forecasting runs into the identical trap from the revenue side; see why full utilization does not mean profitable for that companion view.
Worked example: the same utilization, different margin
Assume a delivery team records 800 selected client hours from 1,000 available hours in a month. On the convention above, utilization is 80%. Now compare two fixed-fee projects that use the same 800 hours and have USD 60,000 of included costs, but different approved fees.
| Metric | Project A | Project B |
|---|---|---|
| Selected hours / available hours | 800 / 1,000 | 800 / 1,000 |
| Workforce utilization | 80% | 80% |
| Approved fee | USD 100,000 | USD 75,000 |
| Included project costs | USD 60,000 | USD 60,000 |
| Project margin dollars | USD 40,000 | USD 15,000 |
| Project margin | 40% | 20% |
The projects produce the same utilization result but a twenty-point margin difference. The approved fee drives the difference in this simplified example. In real delivery, role mix, effective cost rates, scope, discounting, partner costs, infrastructure, and other cost rules can also separate utilization from profitability.
The example holds hours and included costs constant to isolate the fee effect. It is not a target, industry benchmark, revenue-recognition calculation, or prediction of final margin.
Which metric should answer which decision?
| Metric | Question it can answer | What it cannot establish alone |
|---|---|---|
| Workforce utilization | How much defined available time was assigned to selected work? | Whether the project fee covers its costs. |
| Planned vs actual project hours | Did delivery use more or fewer hours than the selected baseline? | The financial impact without cost rates and fee. |
| Budget consumption | How much of a defined project cost budget has been consumed? | How much work is physically complete. |
| Project margin | What remains after the included project costs on the stated basis? | Workforce availability or future staffing capacity. |
| Percent complete | How much agreed scope is complete under a defined method? | Profitability, utilization, or final outcome by itself. |
A useful review puts the relevant metrics next to one another without blending them. For example, a manager can see that actual hours exceed plan, calculate the resulting labour-cost variance, and inspect the current project margin. A separate resource-planning process can address whether people have enough or too much assigned work.
The U.S. Government Accountability Office recommends that cost estimates establish a technical baseline, identify ground rules and assumptions, document the estimate, and update it with actual costs. The principle is applicable here: a metric is defensible only when its baseline and inclusions can be reconstructed.
How does this play out on a staff-augmentation engagement?
Consider a 25-person consultancy running a staff-augmentation engagement: it places five consultants inside a client's IT department for six months, billed on approved hours against a fixed monthly cap rather than a single fixed fee.
At kickoff, the practice lead sets two separate baselines: a workforce-utilization target for each consultant, and the engagement's approved revenue basis and included cost rates using the cost-rate-versus-billing-rate distinction. Treating the two as one number at this stage is the mistake this article warns against.
Mid-engagement, one consultant's utilization climbs because the client keeps extending ad hoc requests within the monthly hour cap. High utilization looks like a delivery success, but if those hours are billed at a lower blended rate than planned, the engagement's margin can still be falling — the same-utilization, different-margin pattern from the worked example above. Check the margin, not just the hours logged.
At the monthly cap review, compare hours consumed against the approved ceiling and recalculate margin from the actual role mix, not the planned one. If a senior consultant covered work planned for a junior role, utilization stays unchanged but cost rises, so the margin recalculation is the only way to see the effect.
At renewal, the client may ask whether utilization data alone justifies extending the engagement at the same rate. Utilization shows the team was fully occupied; it says nothing about whether that occupied time was profitable at the negotiated rate. The renewal decision needs both figures side by side, using the review checklist below, not utilization as a proxy for margin. Managed Margin does not schedule or forecast individual consultant utilization; it recalculates project margin from the hours and rates entered for the engagement.
How does Managed Margin treat these measures?
Managed Margin is project-margin management software. It supports:
- storing role-based cost and billing rates;
- supporting resource-loading scenarios;
- carrying a selected plan into delivery;
- accepting manual weekly actual-hours updates;
- recalculating project gross margin on the product's approved-budget basis.
Permission rules restrict sensitive dollar and rate detail while allowing less-sensitive percentage views.
The product's budget-used calculation compares selected actual delivery costs with the deliverable budget after commission. Its current numerator includes actual labour, partner, and infrastructure costs. That result is project budget consumption, even if an internal technical field uses the word utilization; it is not workforce utilization and does not measure available employee capacity.
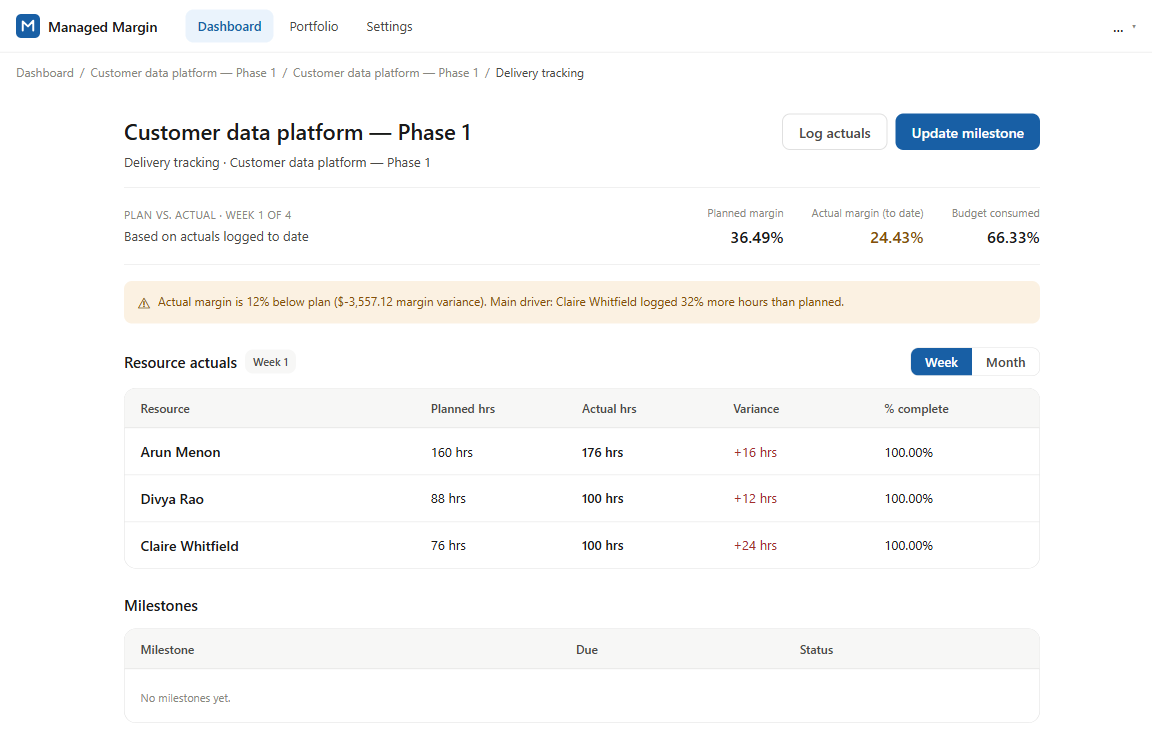
Managed Margin does not provide workforce-capacity planning, automatic timesheet or HR imports, predictive final-margin forecasts, operating margin, or net margin. Actual hours are entered manually. A current margin is a recalculation from recorded inputs, not a guarantee of the final result.
Utilization and profitability review checklist
- Name the decision: staffing availability, delivery variance, budget use, or project margin.
- Define the people, projects, period, and hour categories in the utilization ratio.
- Confirm that available hours and selected hours use the same calendar and population.
- Document the approved fee and every cost category included in project margin.
- Compare planned and actual project hours at the same cut-off date.
- Translate hour variance through the applicable cost rates before drawing a margin conclusion.
- Keep budget consumption distinct from percent complete.
- Investigate combinations: high utilization with weak margin, or low utilization with strong project margin.
- Record missing inputs and limitations beside the result.
For the complete operating context, read the professional-services project margin guide. Then review project budget consumption, the planned-versus-actual margin review, or the project margin calculation.
Sources and methodology
- U.S. Government Accountability Office, Cost Estimating and Assessment Guide. Used for baseline, ground-rule, documentation, and update-with-actuals principles.
- UK Infrastructure and Projects Authority, Cost Estimating Guidance, published 17 March 2021. Used for transparent assumptions, exclusions, evidence, and consistent cost bases.
- Managed Margin product behavior and limitations were reviewed against the current calculation, alert, and permissions implementation on 24 August 2026. The utilization convention and worked figures are explicitly defined illustrations, not external benchmarks.